The analysis and interpretation of compositional data
A paper was recently published in the International Journal of Epidemiology, with the title “A causal inference perspective on the analysis of compositional data”. The paper discusses the concept of compositional data, which is highly relevant for me as a nutritional researcher. Dietary data is inherently compositional, but although I have had an intuitive understanding, I haven’t considered this concept explicitly when thinking about the analysis and interpretation of epidemiological associations.
Compositional data
So what is compositional data? In the paper, it is defined as data that “comprise the parts of some whole, for which all parts sum to that whole”. In other words, compositional data is data where the total can be completely divided into specific parts. For example, total energy intake is made up of energy contributions from carbohydrates, protein, fat, and alcohol. Time, like hours in a day, is another whole. The extent of some wholes, like energy intake, can vary across different values of its parts. If we eat more fat, total energy intake may increase, unless we simultaneously eat less of another energy-yielding nutrient. Other wholes are inherently constrained, like hours in a day. If we increase the amount of physical activity by one hour daily, this must mean we spend one hour less on something else. The length of the day cannot increase by one hour.
Interpreting total or relative effects
When analyzing the association between an exposure and an outcome, we can condition on (i.e. adjust for) other variables. The purpose of conditioning is to keep the value of these variables “fixed” in the model. Depending on which variables we condition on, a different interpretation of the observed association is warranted.
If the whole is fixed, this can be seen as the whole being conditioned on by default. For example, we cannot study the effect of increasing physical activity, without simultaneously studying the effect of decreasing inactivity. Every minute spent being active is replacing a minute being inactive, the total amount of minutes is the same. This means we can only estimate the relative effects of physical activity, relative to inactivity. Hence, one exposure is replacing another, and we only consider the combined, or joint, effect of this substitution. We could subdivide the parts into more categories, and estimate relative effects between specific categories, but we cannot estimate the total effect of one category in isolation as the whole cannot change.
When the total is variable, such as total energy intake, we can estimate relative effects by conditioning on the total. If we include total energy intake as a covariate in the model, thus keeping it constant, any change in carbohydrate intake must be followed by an equivalent (isocaloric) and opposite change in other energy-yielding macronutrients. Because total energy intake is relatively stable within an individual over time, such relative effects are often what we want to estimate. By also keeping other variables constant by including them in the model, like protein and alcohol, we can specifically model the substitution between fat and carbohydrate and assess the joint effect. Such substitution models are widely used in nutritional epidemiology.
However, we can also study the total effect of changing carbohydrate intake by not conditioning on total energy intake. Here, we allow total energy intake to change, and the effect of changing carbohydrate intake may be mediated both via changing energy intake, as well as via other mechanisms – we are estimating the total effect. This could, for example, be the effect of an intervention aiming to add or remove some amount of sugar to the daily food intake, without changing anything else. This would be the case for a switch from a sugar-sweetened beverage to a diet drink. The total effect can be estimated irrespective of any change in the intake of other nutrients, as total energy intake is allowed to change.
Using DAGs to illustrate compositional data
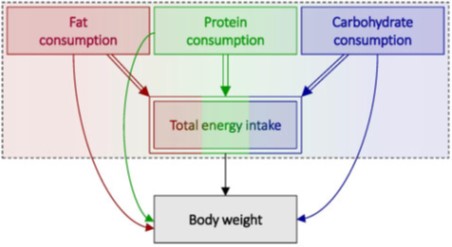
In the paper, these concepts are illustrated with directed acyclic graphs (DAGs), which are non-parametric causal diagrams frequently used for epidemiological model building. Further, new notations are introduced to the DAGs, allowing for the handling of deterministic relationships such as for compositional data, where the whole is made up and determined by its parts. The DAG below illustrates the relationship between total energy intake and body weight, with total energy intake subdivided into the three macronutrients. The double arrows indicate deterministic relationships, the double frame around total energy intake indicates that it is fully determined by arrows going into it, and the dashed rectangle encompasses variables occurring at the same time. I have personally struggled with the problem of including total energy intake in my DAGs, and this paper offered some great tools!
Closing remarks
Nutritional data is inherently compositional, with a variable total. Hence, we can estimate both relative and total effects, and both may be relevant and of interest depending on the context. However, these effects can be very different, and it is crucial that we explicitly identify which effect we are estimating, and interpret and present it accordingly. When conditioning on the total energy intake, which is the recommended and most frequent approach in nutritional epidemiology, it is paramount that the association is interpreted in relative rather than in absolute terms, offering consideration to which food or nutrient is substituted.